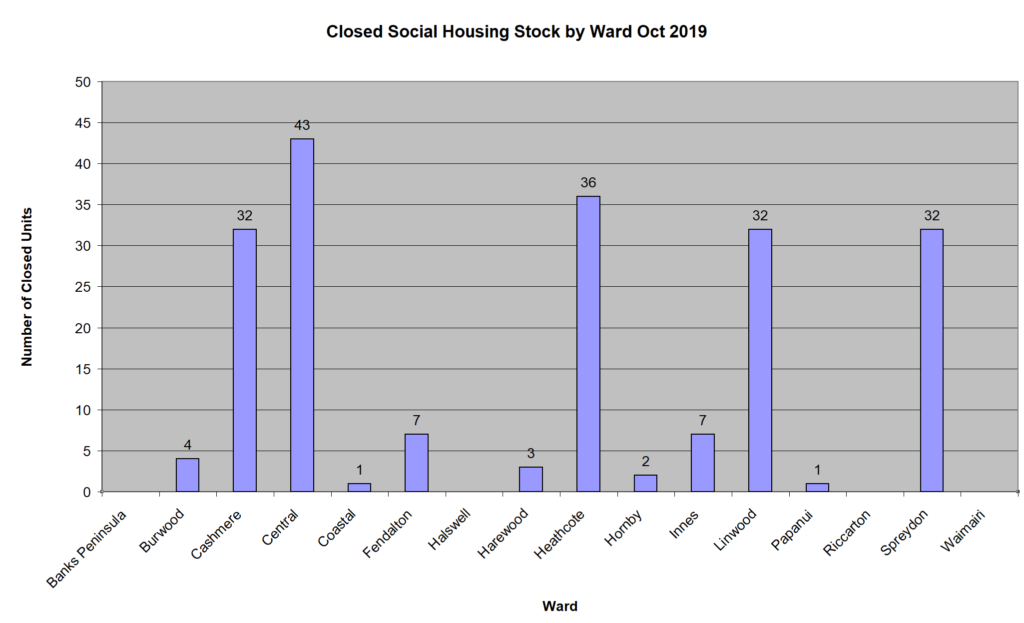
Following the Christchurch earthquakes, many social housing units were closed, however there are many reasons for units to be closed.
The purpose of this graph is to show you how many units were closed in each electrol ward.
In showing elected members this information, we hope to to assist informing your thinking around what stock needs to be returned to your ward.

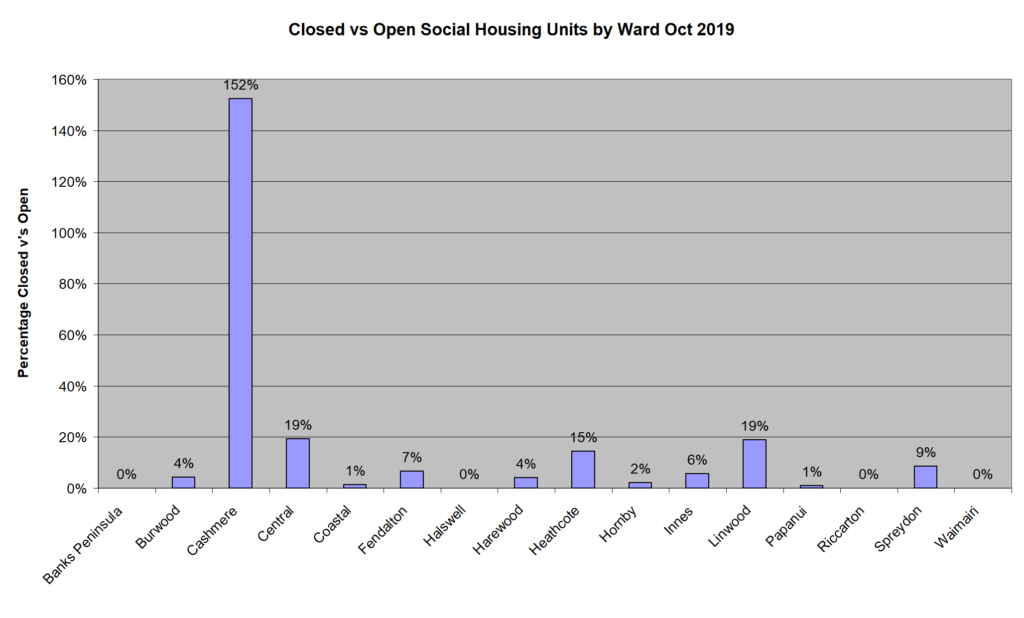
Closed v’s Open Social Housing Units
The purpose of this graph is to help you think about what housing stock has been lost v’s retained.
Clearly Cashmere has lost more than it has gained while Papanui has lost some stock 99% percent of it’s stock is still open.

